Service graphs

|

|

|

|
Graph Information
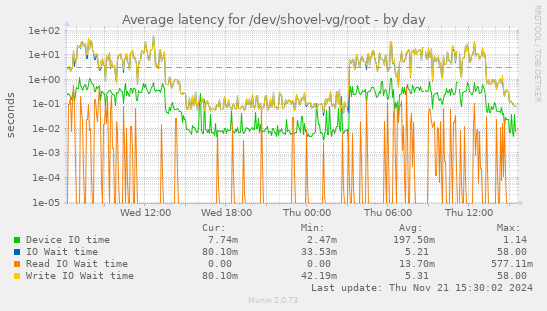
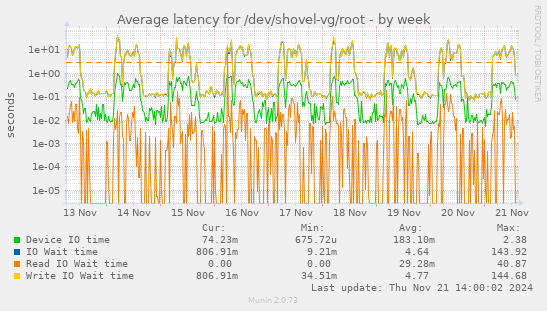
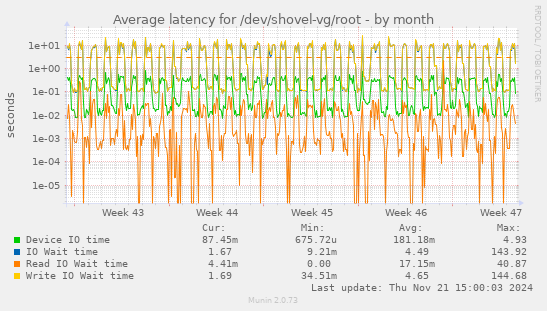
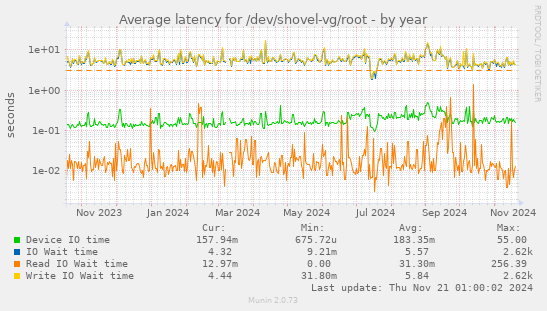
This graph shows average waiting time/latency for different categories of disk operations. The times that include the queue times indicate how busy your system is. If the waiting time hits 1 second then your I/O system is 100% busy.
Note: This service is in WARNING state because one of the values reported is outside the allowed range. Please see further down for information about the ranges and the graph for the values.
| Field | Internal name | Type | Warn | Crit | Info |
|---|---|---|---|---|---|
| Device IO time | svctm | gauge | Average time an I/O takes on the block device not including any queue times, just the round trip time for the disk request. | ||
| IO Wait time | avgwait | gauge | Average wait time for an I/O from request start to finish (includes queue times et al) | ||
| Read IO Wait time | avgrdwait | gauge | 0:3 | Average wait time for a read I/O from request start to finish (includes queue times et al) | |
| Write IO Wait time | avgwrwait | gauge | 0:3 |
Average wait time for a write I/O from request start to finish (includes queue times et al) |